Real-estate solution

Real Estate Spatial Analytics & Property Intelligence

Property-level models, normalized rent-roll workflows, spatial marginal effects, and reviewable visual systems for valuation, underwriting, and asset management.

06 · Real Estate

Commercial real estate lease intelligence.

This completed workflow turns inconsistent spreadsheets and lease schedules into normalized property data, then generates an interactive stacking plan for asset-management and underwriting review.

  • Normalize suites, tenants, areas, dates, rents, escalations, and lease options
  • Identify vacancy, rollover concentration, upcoming expirations, and renewal exposure
  • Move from source files to a reviewable building-level visual and export-ready dataset

The recreation at right uses entirely synthetic building, tenant, and lease information.

Commerce Center lease intelligence
Sanitized recreation · Synthetic data
As of 12/31/2026View Stacking plan + rent rollRollover Next 36 months
Leased area87.6%
Available area12.4%
Active leases19
Next rolloverQ3 2027
Floor stacking planLinked to rent roll
15
Northline Design
Available
14
Summit Advisory
13
CivicWorks Studio
Prairie Legal
12
Available
Redwood Partners
11
Atlas Engineering
Current leaseAvailable / month-to-monthHigh rollover exposureMedium rollover exposure
Normalized rent roll5 visible rows
SuiteTenantAreaLease endReview
1500Northline Design8,42009/30/27Watch
1400Summit Advisory13,80006/30/31Current
1305CivicWorks Studio5,26012/31/28Monitor
1310Prairie Legal7,04003/31/29Current
1200Available3,160Market
Lease-expiration exposure% of area
22%202718%202825%202935%2030+
Source filesExtractNormalizeLinkReview
Sanitized recreation based on completed rent-roll and stacking-plan work. All building, tenant, area, rent, and lease values are synthetic.

Parcel and location intelligence

See local effects and property patterns—not only portfolio averages.

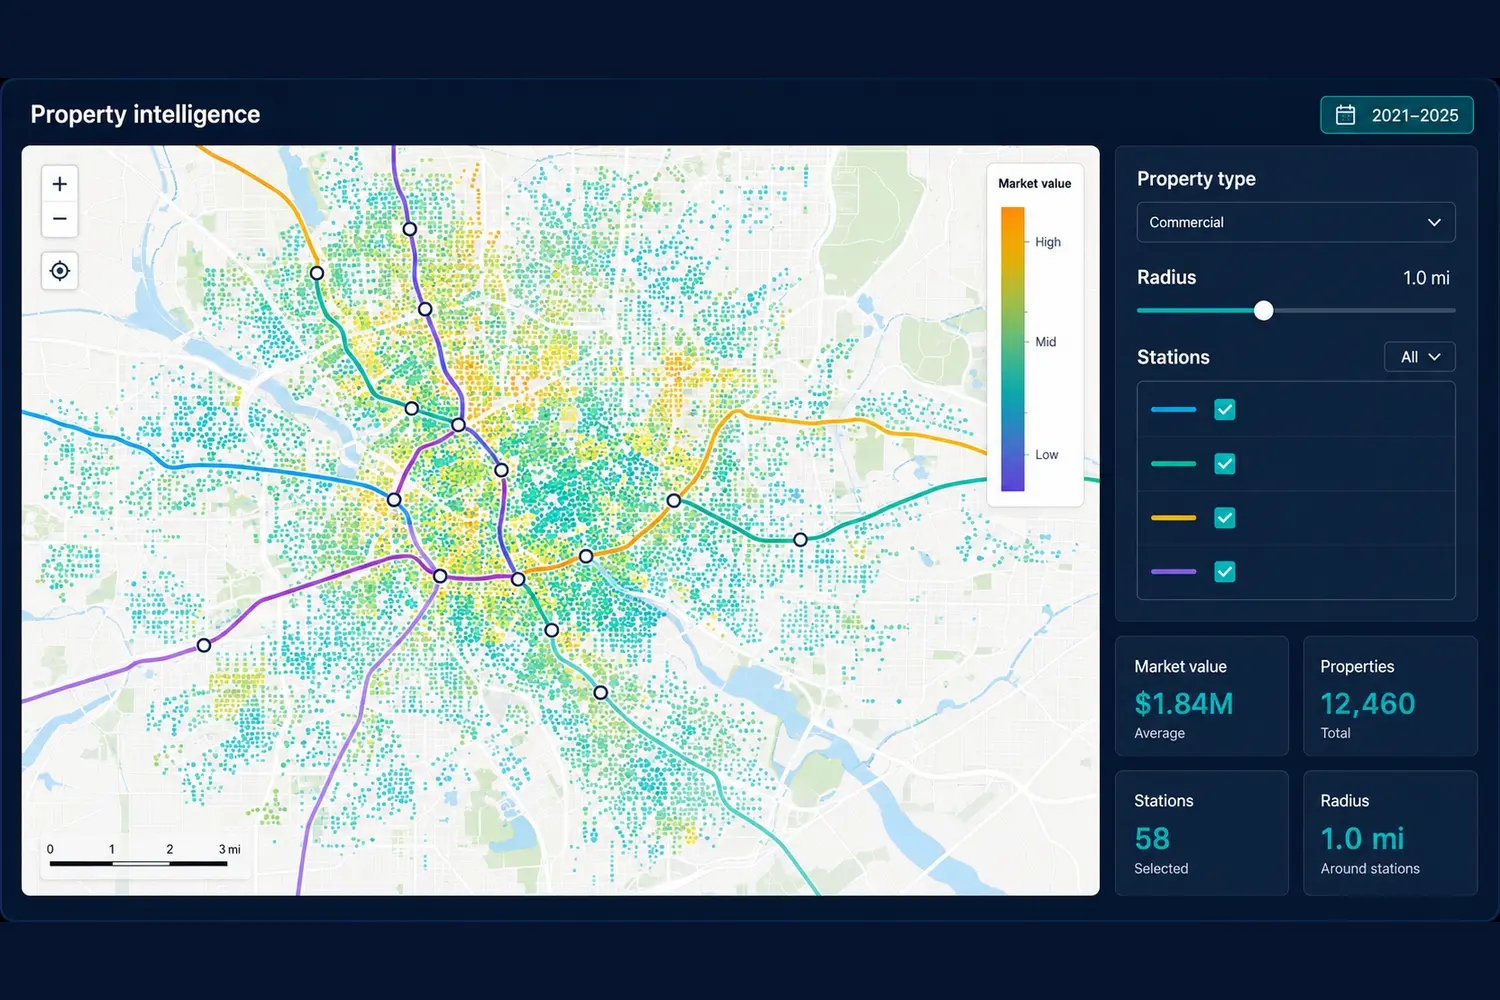
Parcel-level modeling can reveal how estimated relationships vary across space, while browser dashboards connect property values, infrastructure, filters, and market context in one reviewable system.
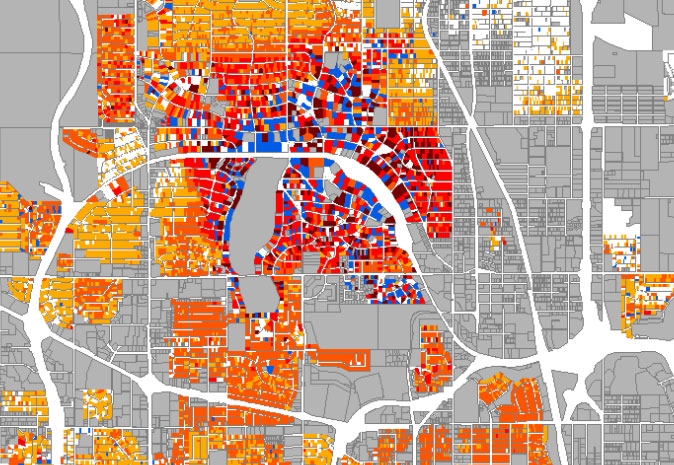
Parcel-level map of estimated local square-footage marginal effects, ranging from negative blue effects through neutral white to positive yellow, orange, and red effects.
Parcel-level local marginal effects from Dearmon & Smith, “A Hierarchical Approach to Scalable Gaussian Process Regression for Spatial Data,” Figure 21(c).
Illustrative property-intelligence dashboard with parcel values, transit alignments, filters, and summary metrics.
Marketing illustration inspired by completed parcel-and-transit dashboard work. Organization names and client data have been removed.

Property intelligence

Connect property data to the decisions it must support.

Define the assets, source files, geography, analytical question, validation standard, and property-level outputs required.

Discuss this solution